Aandeel Nanotechnologie
Nanophase
NANX
Charts
Nanotechnologie houdt een grote belofte in. De toepassingen zijn enorm. Het is interessant om via de aandelenkoers (www.stockcharts.com) de commerciele ontwikkeling te volgen. Of meer de sentimenten? Een voorbeeld is de koers van NANX = Nanophase Technologies Corporation (Nanophase). De onderstaande tekst is ontleend aan Internet. Uiteraard zegt de informatie niets over het toekomstig koersverloop, laat staan de toekomst van de hele sector.
Het is een momentopname op 9 augustus 2010 voor de opening van de NASDAQ.
Bedrijfsprofiel
Nanophase Technologies Corporation (Nanophase) develops applications and produces engineered nanomaterial products for markets, including sunscreens, personal care, architectural coatings, architectural window cleaning and restoration, industrial coating ingredients, plastic additives, semiconductor polishing, optics polishing and other markets. The Company develops and commercially manufacturers a range of nanomaterials and dispersions. In 2010, Nanophase launched direct-to-user products, the NanoUltra line of architectural window cleaning and restoration products. The Company’s nanomaterials platform includes two manufacturing processes to make nanomaterials or nanoparticles: PVS and NanoAr Synthesis. These technologies allow Nanophase to control critical nanomaterial properties (composition, size, shape, structure, surface chemistry) and engineer those to meet specific application performance
Maandkoersen NANX
Interpretatie
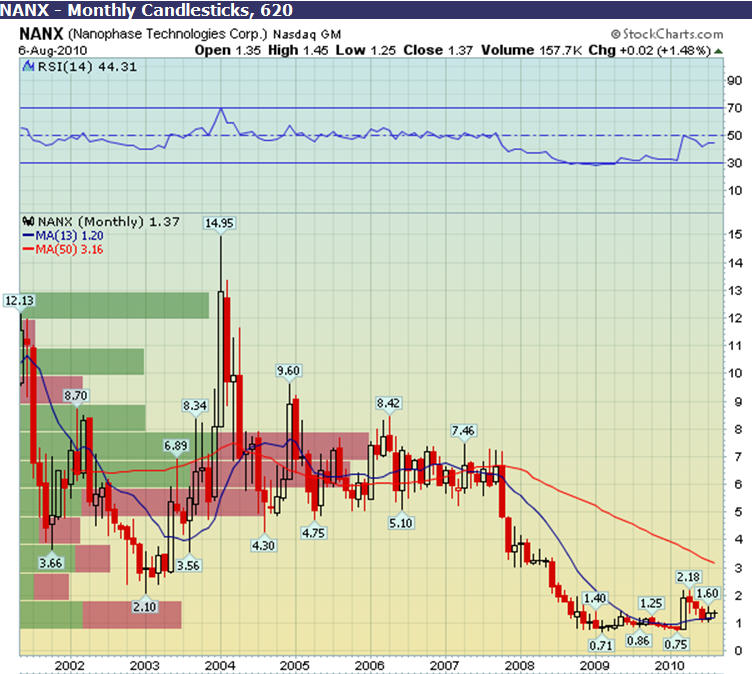
De maandgrafiek laat zien dat de koersen in 2002 en 2004 tot $ 13 zijn opgelopen. Na dieptepunten tot onder de dollar in 2009 in 2010 gaat het nu weer wat beter.
NANX Weekkoersen
Interpretatie
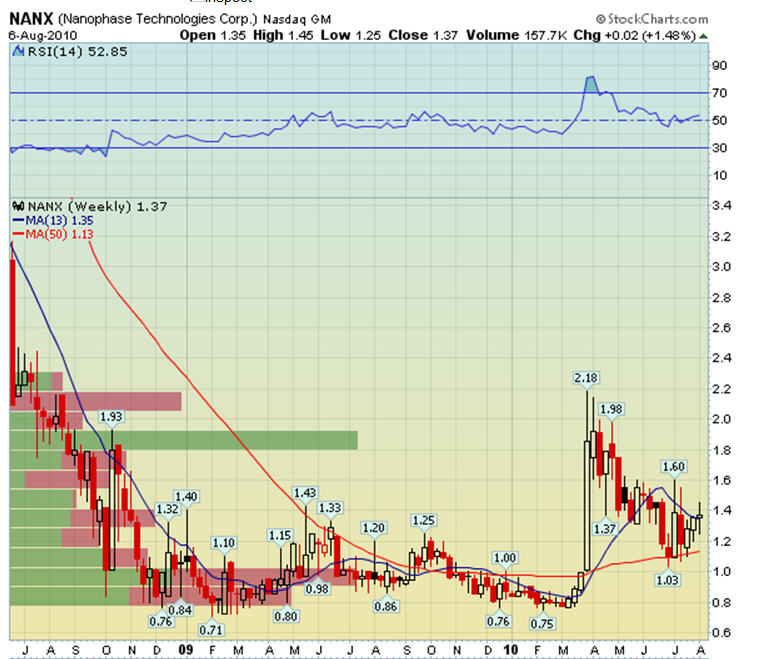
De weekkoers grafiek laat nog beter zien dat er sprake is geweest van een dubbele dip. De suggestie kan zijn dat de koers nu omhoog kan gaan.
Dagkoersen NANX
Interpretatie
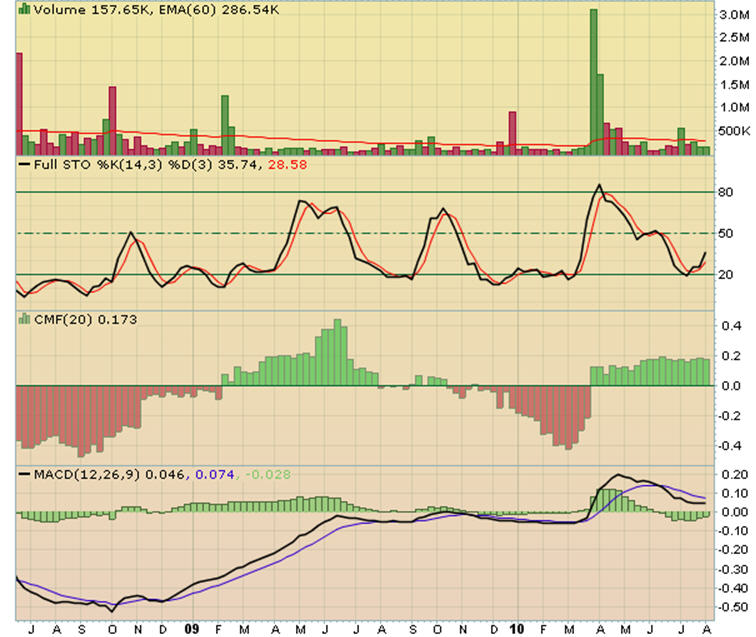
De dagkoers grafiek toont een beeld van stijgende bodems. Dus ook positief beeld.


